Stockcharts.com: Weekly review
After a 1 week hiatus, how are the public listers rating the market now?
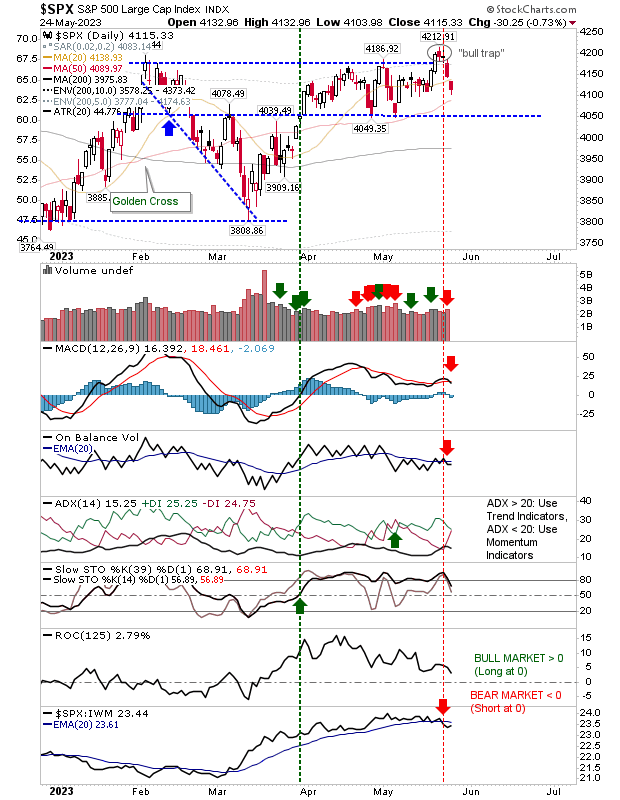
Joe Reed hadn't much to add to my earlier review of his charts. However, he has a new chart highlighting the convergence of indices into a potential top; perhaps similar to how converges of the indices in August 2004, April 2005 and June 2006 marked bottoms?

He has also pointed to a convergence of tops in the RSI and Ultimate Oscillator of the Dow (but haven't we all!).

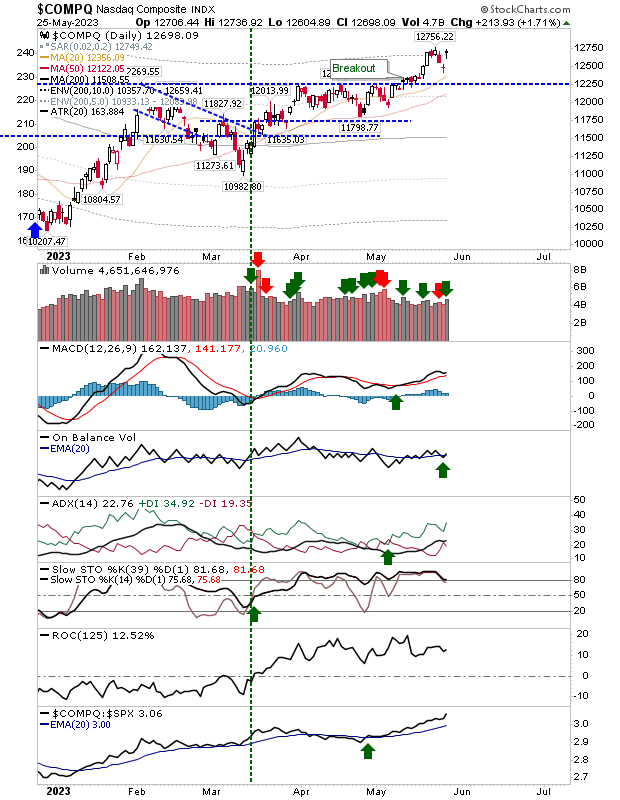
Mitchell Meana has taken a more optimistic view; he is looking at a potential fifth wave rally up for the Qs/Nasdaq 100:


With a crude head-and-shoulder reversal in the Nasdaq:

His bullish count extends to large and small caps (note declining volume in the IWM as it makes each new high - this could throw a spanner in the works for the bull count):


Joe Reed focused on the Energy Select SPDR (XLE); he highlights the action the ETF suffered during August when it traded at resistance and how it is repeating itself now. Further information is available at his website:

and a similar view for GLD:

He has also marked support/resistance on the 30-min Qs chart:

With the Russell 2000 stuck at resistance:

Perhaps his PnF chart for the Nasdaq and its upside target of 2,540 will provide some support to Mitchell's fifth wave run?

Robert New has stuck to his cup-and-handle prediction for the Nasdaq. The negative divergence in supporting technicals dominating the picture:

and is optimistic over the longer term:

In summary, the Stockcharters look to favor another leg of the rally before things turn sour. The bulk of the indices do trade at resistance, but a break of these levels cannot be excluded from the equation. Richard Lehman has 2 pages of intraday channels drawn for the indices which are worth checking out (this week's review was a little long to include them). Cautious optimism, perhaps?
Stockcharts.com
Joe Reed hadn't much to add to my earlier review of his charts. However, he has a new chart highlighting the convergence of indices into a potential top; perhaps similar to how converges of the indices in August 2004, April 2005 and June 2006 marked bottoms?
He has also pointed to a convergence of tops in the RSI and Ultimate Oscillator of the Dow (but haven't we all!).
Mitchell Meana has taken a more optimistic view; he is looking at a potential fifth wave rally up for the Qs/Nasdaq 100:
With a crude head-and-shoulder reversal in the Nasdaq:
His bullish count extends to large and small caps (note declining volume in the IWM as it makes each new high - this could throw a spanner in the works for the bull count):
Joe Reed focused on the Energy Select SPDR (XLE); he highlights the action the ETF suffered during August when it traded at resistance and how it is repeating itself now. Further information is available at his website:
and a similar view for GLD:
He has also marked support/resistance on the 30-min Qs chart:
With the Russell 2000 stuck at resistance:
Perhaps his PnF chart for the Nasdaq and its upside target of 2,540 will provide some support to Mitchell's fifth wave run?
Robert New has stuck to his cup-and-handle prediction for the Nasdaq. The negative divergence in supporting technicals dominating the picture:
and is optimistic over the longer term:
In summary, the Stockcharters look to favor another leg of the rally before things turn sour. The bulk of the indices do trade at resistance, but a break of these levels cannot be excluded from the equation. Richard Lehman has 2 pages of intraday channels drawn for the indices which are worth checking out (this week's review was a little long to include them). Cautious optimism, perhaps?
Stockcharts.com